Release

Release

January 24, 2024

January 24, 2024

Introducing Visual Variables

Make last second changes to your upcoming Visuals, with Variables.

Hidde Schultze

Technical Founder
Visuals are an excellent means to present dynamic data or static information to your audience. With the help of the Visual Designer Data Context, you can already utilize the vast and rich dataset delivered by Visual Radio Assist. This integration connects all your existing radio broadcasting systems into a comprehensible datamodel.

Now, introducing even more dynamic data on-the-fly with Visual Variables! You have the capability to add your own data into the VRA Datamodel using Visual (or Station) Variables within the Visual Designer!

Visual Variables

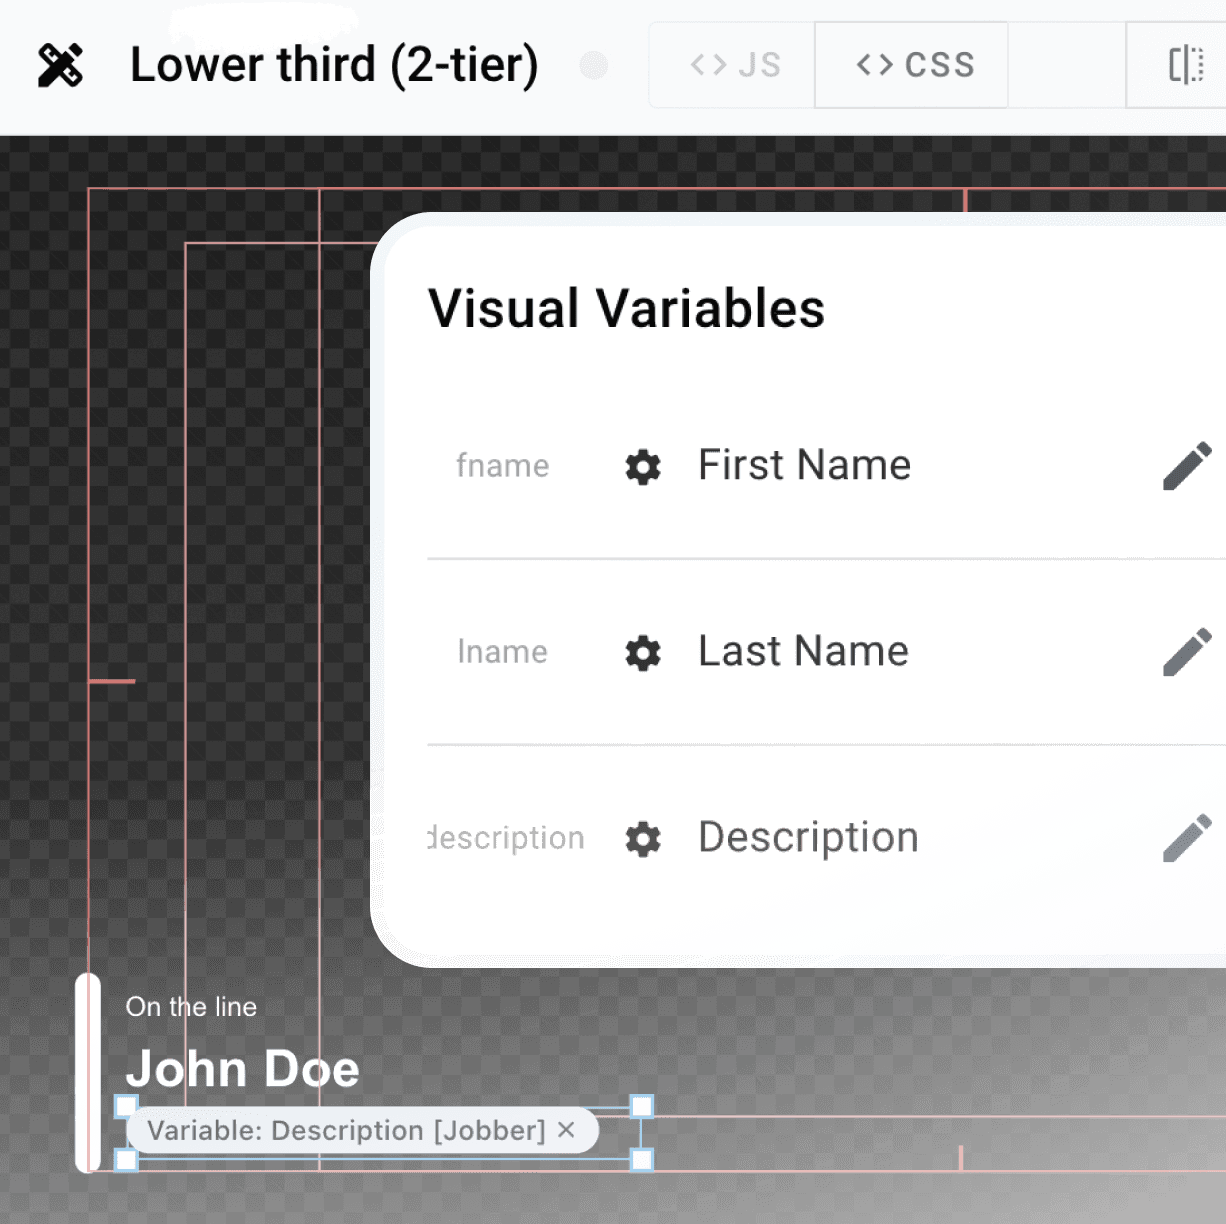
Visual Variables are a quick way to add "variable" data to Visuals, which can later be modified by various users or actions. The variables you create are placeholders for the configured "real value" of the Variable, this could be User Input, Media from the Library or ad-hoc uploaded Media. But soon also be data from custom external API's, RSS Feeds or large datasets.

The variables are scoped to the Visual and thus great to use in designs of Show-specific Visuals, Lowerthirds and other variable graphics which should be updated regularly. These Visual scoped Variables will by default show the default value you've configured. But in most scenario's you want to be able to change the values of the variables within a specific Output Rundown the Visual is playing:

Visual → Rundown Variables

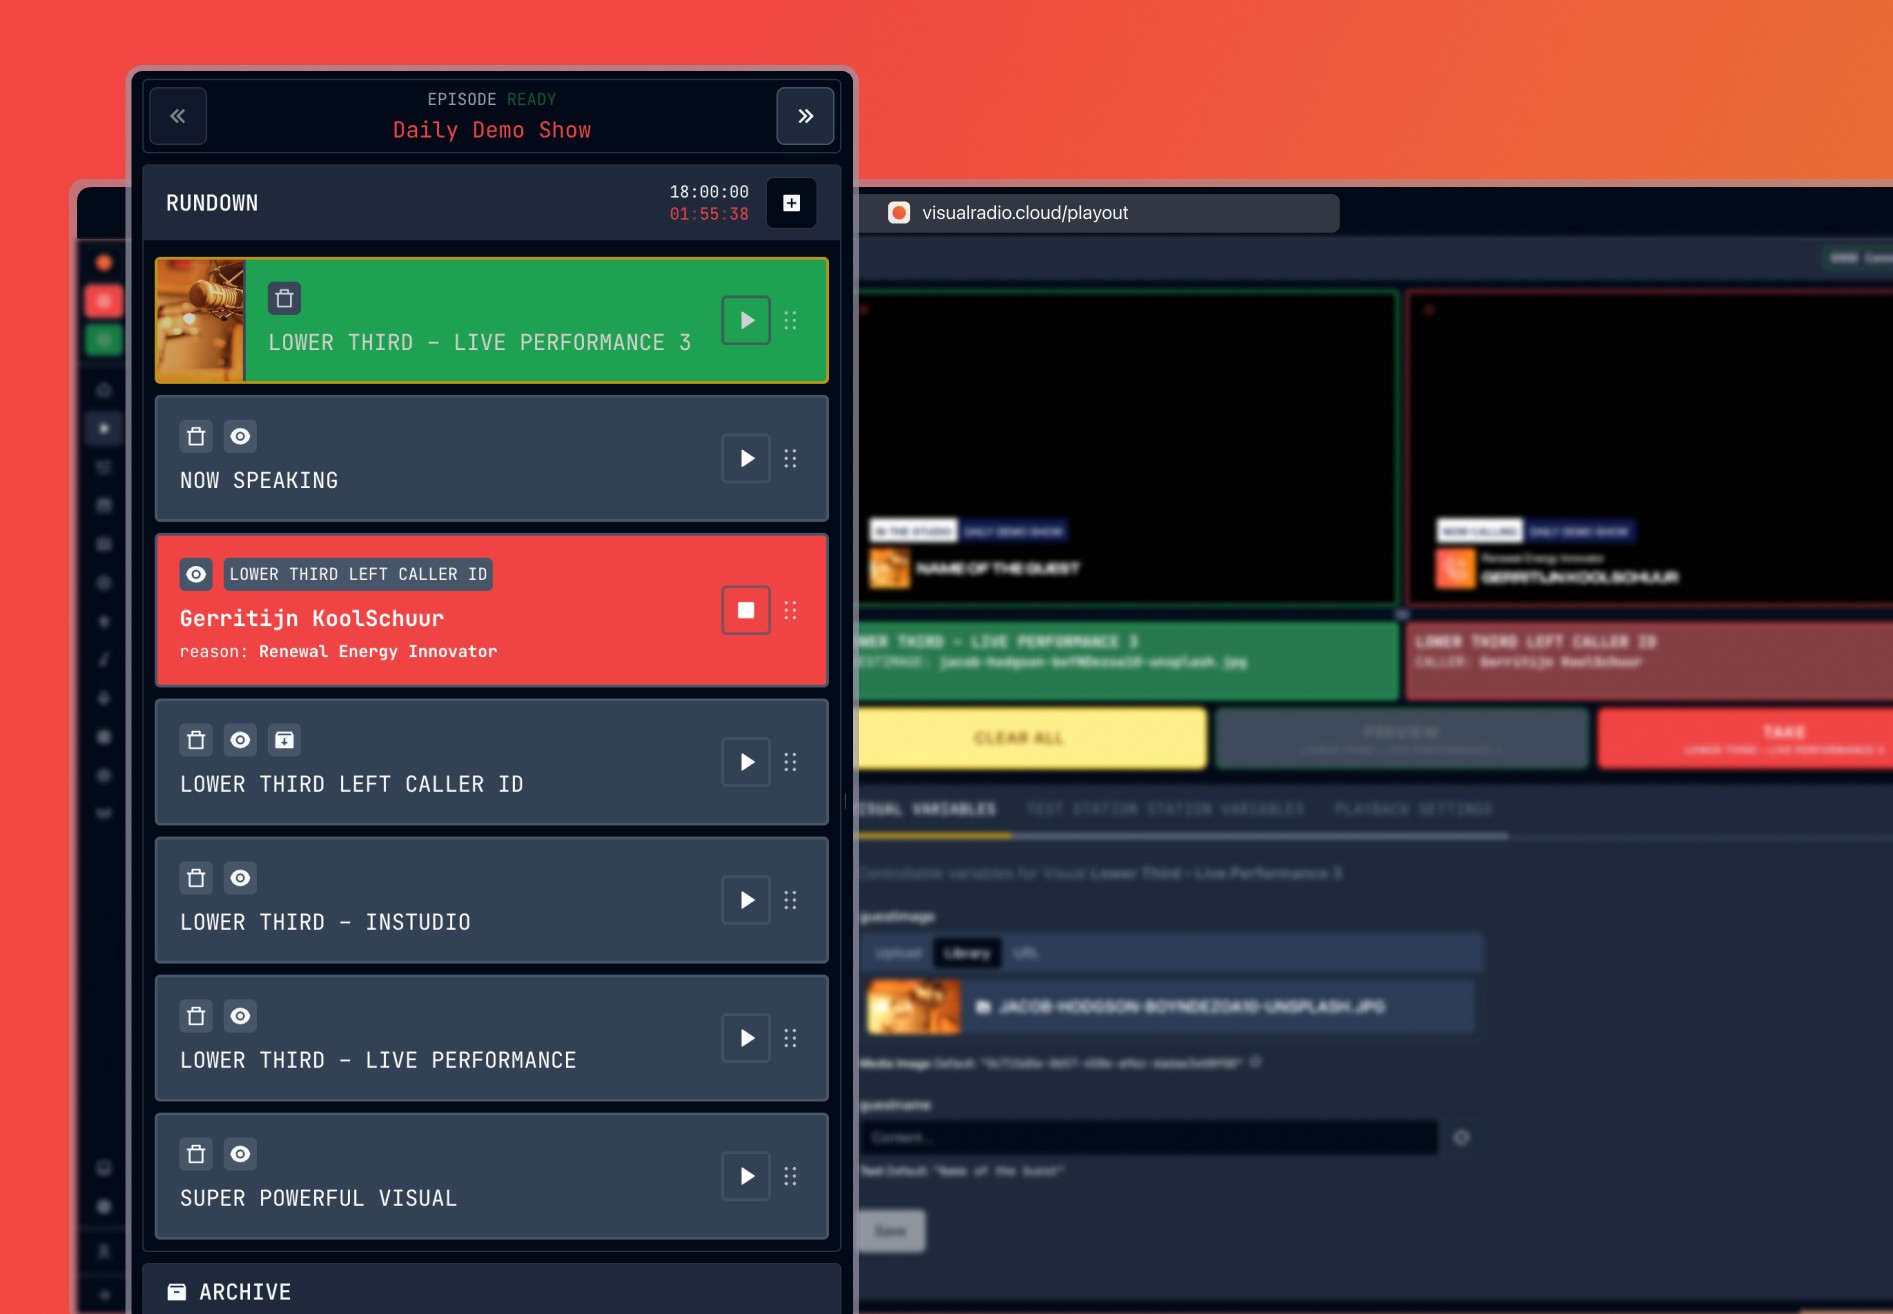
The Rundown player has been rebuild in version 4.1, which enables us to deliver more dynamic Visual-playout options to your Outputs. The new Visual Variables are directly available in the Rundown Editor, where you could set the live-value of the configured Variable.

After adding a Visual as a item to a rundown in the Output Editor, the Visual item is from now on completely unique. This means that you can add multiple items of the same Visual, but you'll still be able to uniquely set the Variable values!

Create your first variable Variables in the updated Designer →

Station Variables (Global)

Station Variables are much alike Visual Variables, with the big difference in scope. Station Variables are scoped to all Visuals of the Station. A perfect match for using the same variablepowers in a central place to manage data for tickers, global news items or station logo's in one global place. No more copy pasting and repeating the same task to make sure your Station graphics are up to date.

Check out Station Variables in your Output Settings→

Enhancements to the Designer
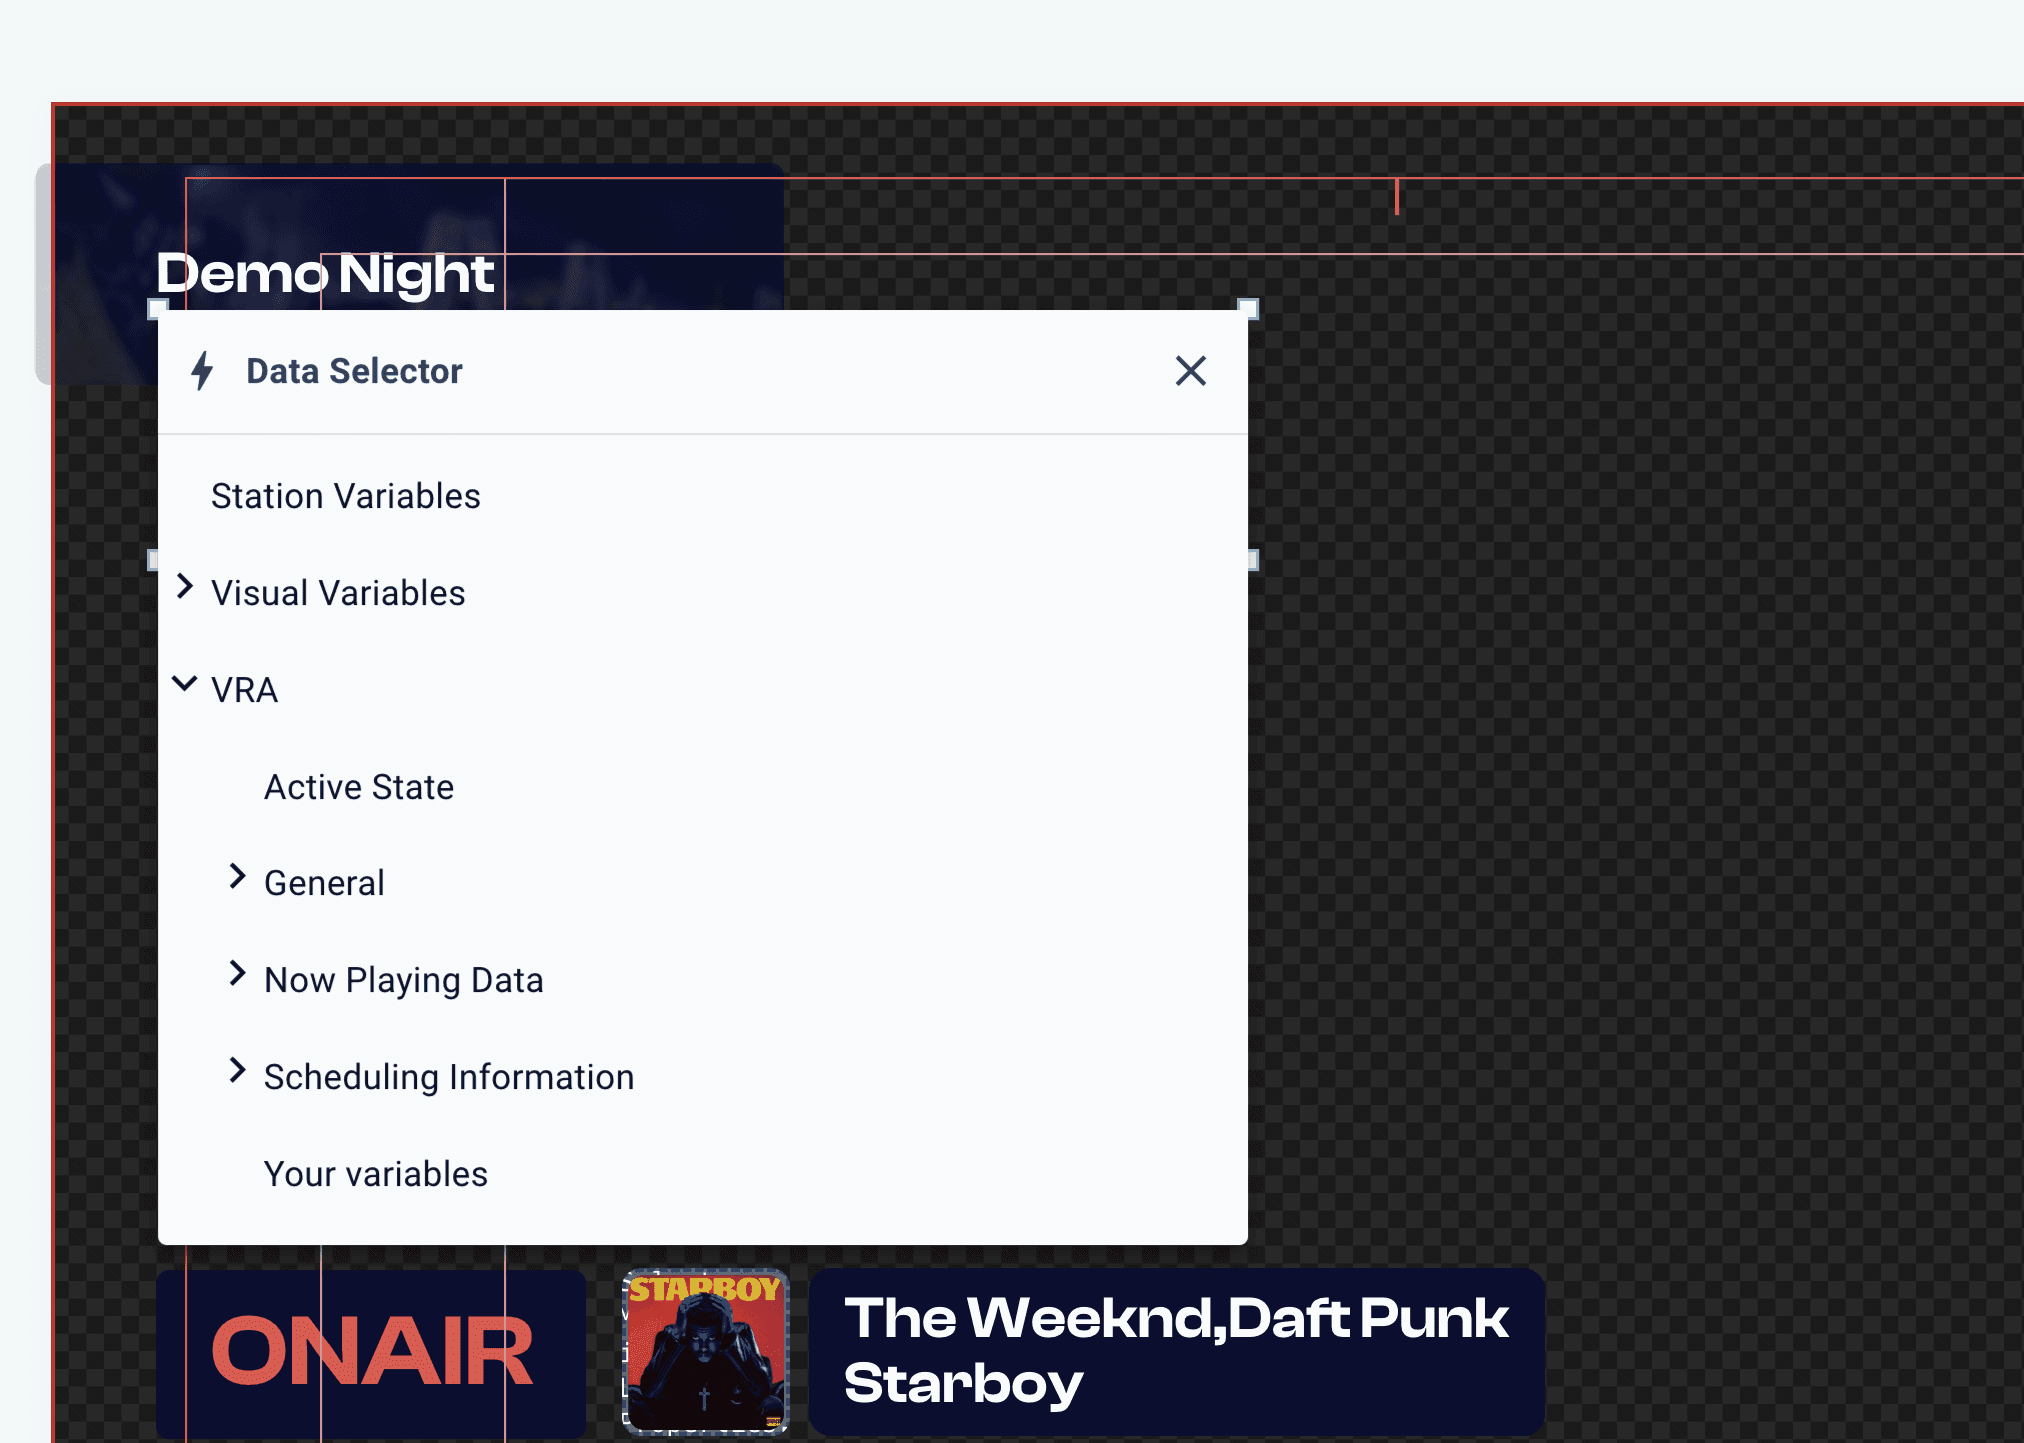
New Data Selector popup in the Designer Text Editor

As demonstrated in the brief video, the Designer has received a subtle experience makeover for editing dynamic text. The Data Context is now accessible through the '/' menu, placing all available data elements conveniently at your fingertips.

We've also implemented several quality-of-life improvements to enhance the visualization and user experience of Data Elements within text. You can now effortlessly manage the utilized data elements using these blocks, which also provide a user-friendly version of the technical element.
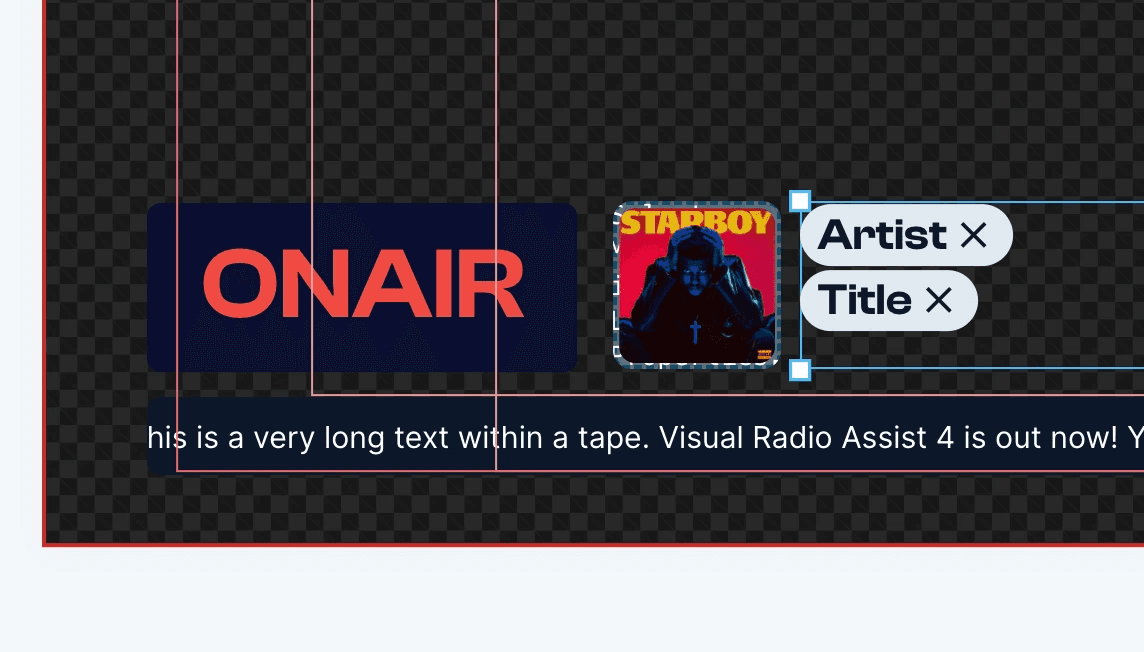
New Data visualization in the Designer Text Editor

Stay Tuned

What if, in addition to the Advanced Output Editor, there is another professional method for managing Outputs that contain your dynamic graphics? Variables get even more useful in the new 4.1 updates. Check out the brand new Visual Radio Live Graphics Playout now!

Visuals are an excellent means to present dynamic data or static information to your audience. With the help of the Visual Designer Data Context, you can already utilize the vast and rich dataset delivered by Visual Radio Assist. This integration connects all your existing radio broadcasting systems into a comprehensible datamodel.

Now, introducing even more dynamic data on-the-fly with Visual Variables! You have the capability to add your own data into the VRA Datamodel using Visual (or Station) Variables within the Visual Designer!

Visual Variables

Visual Variables are a quick way to add "variable" data to Visuals, which can later be modified by various users or actions. The variables you create are placeholders for the configured "real value" of the Variable, this could be User Input, Media from the Library or ad-hoc uploaded Media. But soon also be data from custom external API's, RSS Feeds or large datasets.

The variables are scoped to the Visual and thus great to use in designs of Show-specific Visuals, Lowerthirds and other variable graphics which should be updated regularly. These Visual scoped Variables will by default show the default value you've configured. But in most scenario's you want to be able to change the values of the variables within a specific Output Rundown the Visual is playing:

Visual → Rundown Variables

The Rundown player has been rebuild in version 4.1, which enables us to deliver more dynamic Visual-playout options to your Outputs. The new Visual Variables are directly available in the Rundown Editor, where you could set the live-value of the configured Variable.

After adding a Visual as a item to a rundown in the Output Editor, the Visual item is from now on completely unique. This means that you can add multiple items of the same Visual, but you'll still be able to uniquely set the Variable values!

Create your first variable Variables in the updated Designer →

Station Variables (Global)

Station Variables are much alike Visual Variables, with the big difference in scope. Station Variables are scoped to all Visuals of the Station. A perfect match for using the same variablepowers in a central place to manage data for tickers, global news items or station logo's in one global place. No more copy pasting and repeating the same task to make sure your Station graphics are up to date.

Check out Station Variables in your Output Settings→

Enhancements to the Designer

New Data Selector popup in the Designer Text Editor

As demonstrated in the brief video, the Designer has received a subtle experience makeover for editing dynamic text. The Data Context is now accessible through the '/' menu, placing all available data elements conveniently at your fingertips.

We've also implemented several quality-of-life improvements to enhance the visualization and user experience of Data Elements within text. You can now effortlessly manage the utilized data elements using these blocks, which also provide a user-friendly version of the technical element.

New Data visualization in the Designer Text Editor

Stay Tuned

What if, in addition to the Advanced Output Editor, there is another professional method for managing Outputs that contain your dynamic graphics? Variables get even more useful in the new 4.1 updates. Check out the brand new Visual Radio Live Graphics Playout now!

stay in the loop

Subscribe for everything Visual Radio.

stay in the loop

Subscribe for everything Visual Radio.

stay in the loop

Subscribe for everything Visual Radio.

stay in the loop

Subscribe for everything Visual Radio.